Screenshots from clearISE
Main
Emulator Window | Register Viewer | Memory
Viewer
Breakpoints | Instruction
Window | Visualisation
Preferences
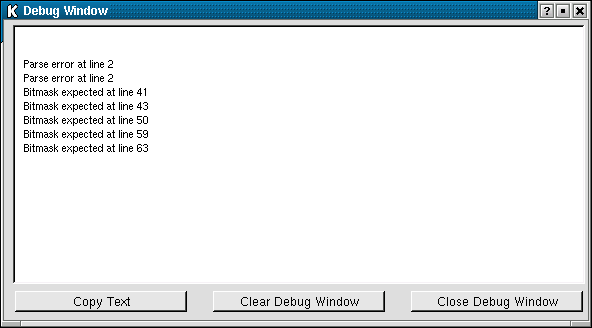
Debug Window
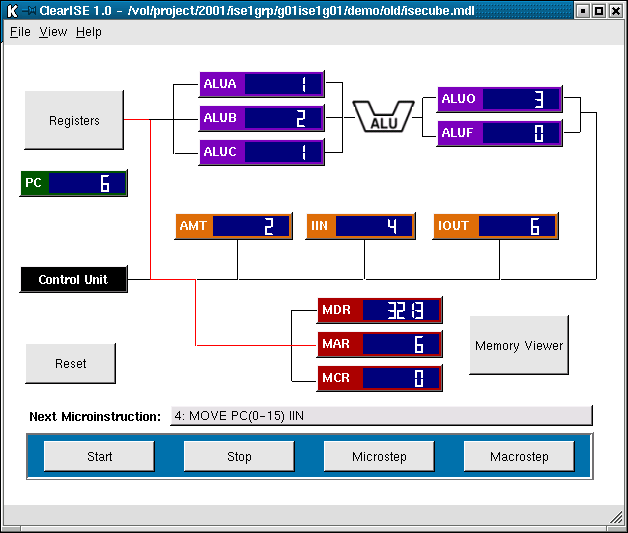
The main window provides access to the other features of the emulator – the memory and register viewers are accessible directly by clicking on the appropriate buttons, and the other features such as breakpoints and the instruction viewer can be found in the "View" menu.
The next microinstruction to be executed is displayed above the button panel, and after each microinstruction has completed, the registers on the GUI are updated with any changed values, and the red line shows the data path between source and destination, as shown in the screenshot. Where the source is a constant value, only the destination line segment will be highlighted in red.
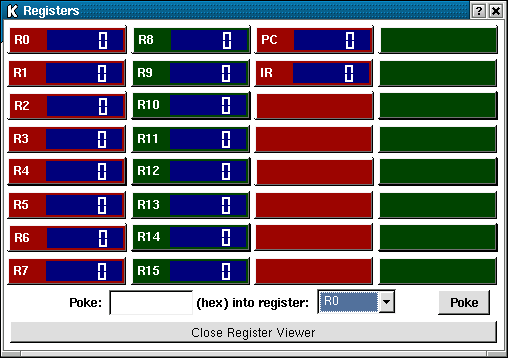
The register viewer shows the contents of all registers that are in use for the specified architecture, as defined by the MDL file. Although the icISE hardware specification contains 32 general purpose registers, any unused ones will be hidden. It is also possible to poke hex values into a register from here.
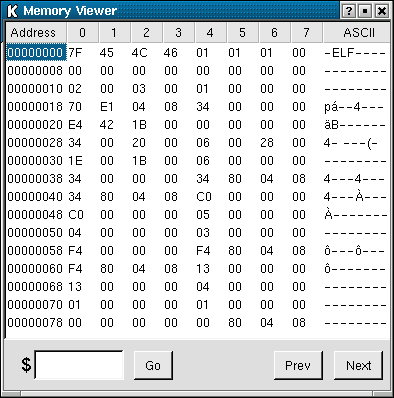
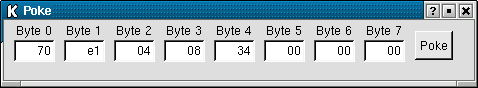
The memory viewer enables the entire contents of the defined memory region to be displayed, either page by page, or to jump to a specific hex location. Values are displayed as hex bytes and these can be altered by simply double-clicking on the relevant byte to bring up the "poke" window.
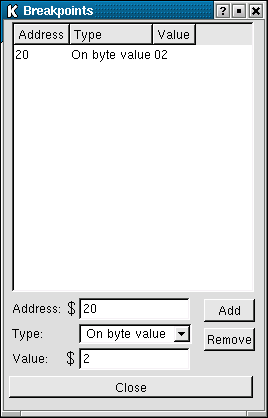
Breakpoints provide the ability for execution to be halted when a given condition is met. When the condition is reached, the application will bring up a pop-up box indicating the address at which the breakpoint has occurred and the value contained within that location. Execution can then be continued by pressing the START button on the main window.
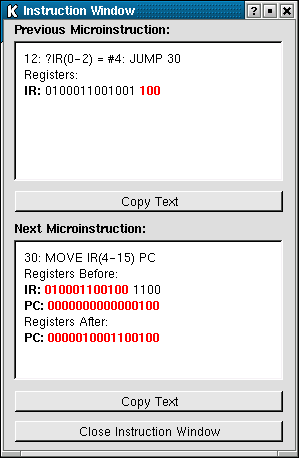
This window displays the previous and the next microinstruction as shown in the screenshot. The two windows show 16-bit binary values for registers that were used during the execution of the microinstruction, both source and destination. Where only part of the register has been accessed, only the relevant bits will be displayed in red and separated by a space character – the other bits will be displayed in black.
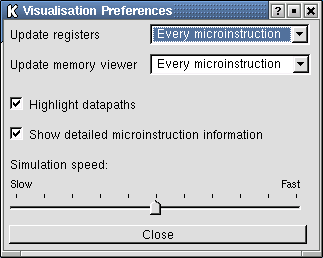
The visualisation preferences window provides a number of GUI configuration options which are generally self-explanatory. The drop-down lists enable registers and/or memory to be updated every microinstruction, every macroinstruction or only when execution has completed. The intention is to allow the user to control the speed of execution, by both increasing the simulation speed and by reducing the overhead of the GUI by disabling features such as datapath highlighting.
The debug window displays error message output by the parser when an MDL file is read in and is found to be invalid.